CoreWeave Contagion, Checked: An Independent Investigation of the AI Financing Chain
Independent investigation · Published October 19, 2026 · Data window: market close Oct 9 to Oct 16, 2026
A widely shared video this week argued that CoreWeave's funding stress is spreading through the AI infrastructure chain — and that the “best phase” of the AI trade may be over. We did not take its word for any of it. We checked each of its eight claims against primary reporting and company disclosures, dug for the evidence on the other side, and mapped where the names in our own research sit on this chain. This page is the result: what the evidence supports, what it doesn't, and the signals we will use to tell contagion from a genuine turn in expectations.
XingAI Hot-Topic Investigations No. 1 — an independent check of the CoreWeave contagion claims. Data as of Oct 16, 2026 close.
Video edition
The video edition of this report, published in the Hot-Topic Investigations column on @axingstocks.
In the second week of October 2026, hotter-than-expected September inflation data lifted bets on Fed rate hikes; the 10-year Treasury yield touched 5.32% mid-week and closed Friday around 5.10%-5.13%. Against that macro trigger, the AI infrastructure chain suffered a selloff led by the credit market:
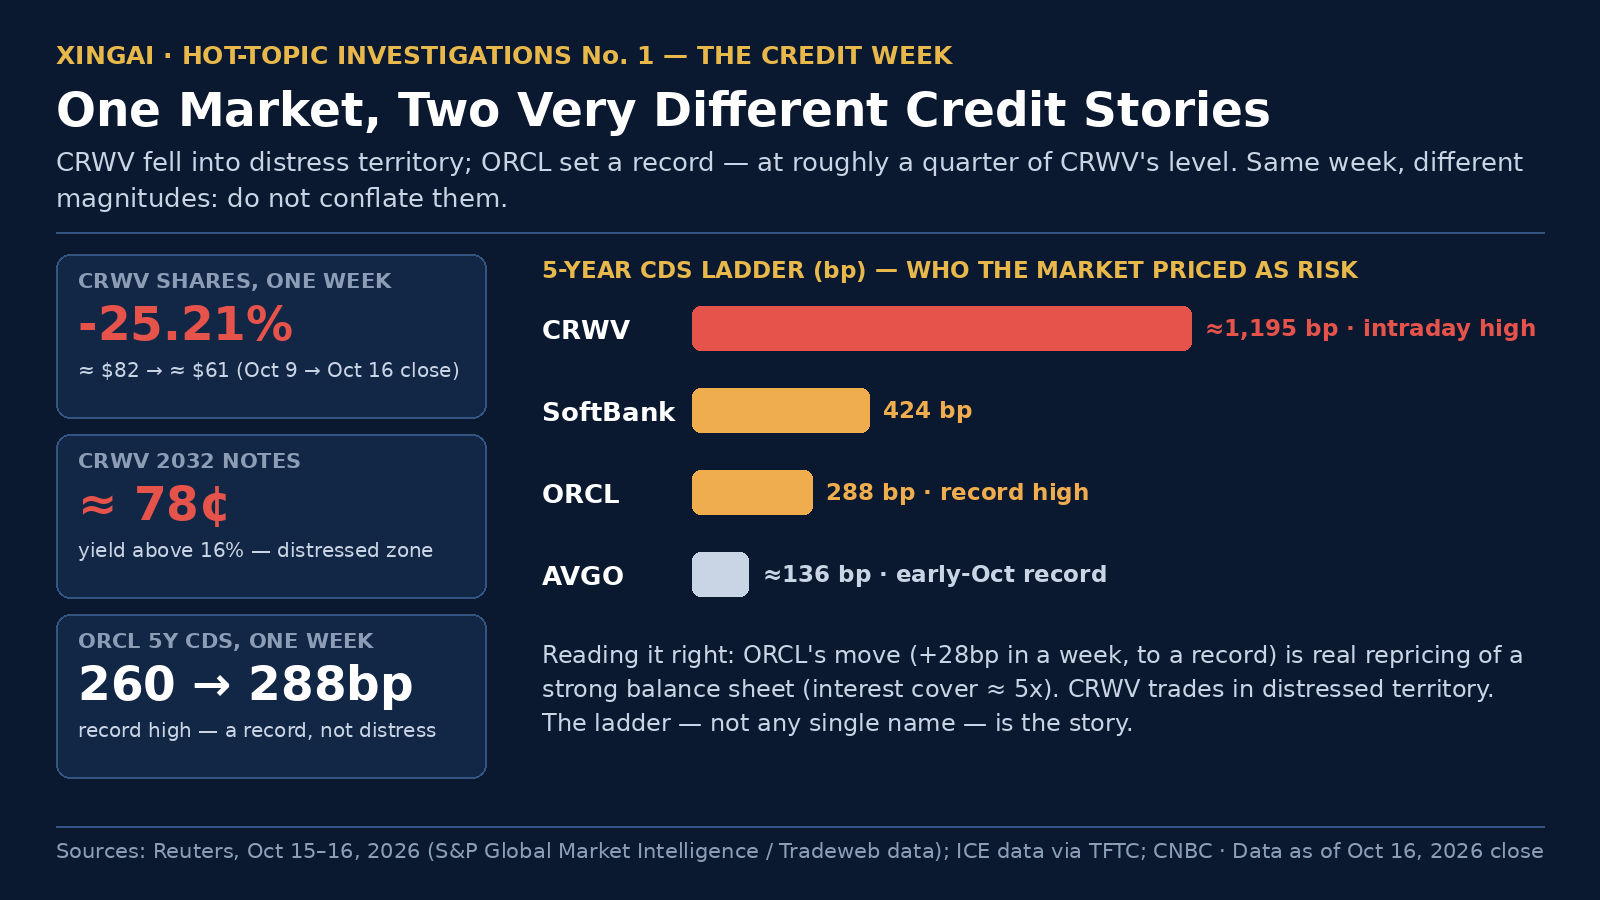
CoreWeave (CRWV) fell from about $82 at the October 9 close to about $61 at the October 16 close, roughly -25% in a week — its worst week in about 11 months. On Wednesday (10/14) alone it fell 15.5%, and shorts made about $806M that day (ORTEX data, via Reuters).
CRWV's bonds fell into distressed territory: the 2032 notes traded at about 78 cents with yields above 16%, and five-year CDS hit an intraday high of about 1,195bp.
Credit stress spread, but in clear tiers: Oracle's (ORCL) five-year CDS hit a record 288bp, while Amazon, Alphabet, Meta and Nvidia CDS also set records but widened far more slowly (Reuters, Oct 15).
Equities de-levered at the same time: hedge fund net exposure fell to the 30th percentile of five years while gross exposure stayed above the 90th (UBS desk); Goldman prime brokerage data showed global long/short funds down 2.9% on the week, with AI stocks net sold for six straight sessions.
In the same week, TSMC reported a sixth straight record quarter (Q3 net income NT$763.06B, +69% year on year) and management said advanced-node demand “far exceeds what we can supply today” — the demand side did not weaken in sync. That gap is the core of our disagreement with the “AI trade is over” reading; see our conclusions below.
Same week, different magnitudes — ORCL's record is real repricing; CRWV is distress. Do not conflate them. Sources: Reuters (S&P Global Market Intelligence / Tradeweb), ICE via TFTC, CNBC.
The eight claims, checked one by one
The starting point was a set of eight claims circulating in market media this week. Each was checked independently against at least two sources. Verdicts: Confirmed means the evidence supports the claim as stated; Partially confirmed means the direction holds but the number, scope or attribution does not; Confirmed (scope corrected) means the figure is real but is a different kind of statement than it was presented as.
#
Claim
Verdict
Basis in one line
1
“CRWV fell about 25% in a week, and the memory sector fell about 16%”
Stock move confirmed; memory only partially — and the cause is misattributed
CRWV -25% confirmed by four sources; memory names fell 14.6%-17.9%, driven mainly by CXMT news, not CRWV contagion
2
“CRWV bond yields rose above 16%”
Confirmed — with the specific bonds named
Reuters: 2032 notes at about 78 cents with yields above 16%; 2031 notes briefly through 16% intraday
3
“Morgan Stanley tracks about $14.1B of data-center project bonds dependent on CoreWeave rent — about 30% of its tracked total”
Partially confirmed — the mechanism and the scale have support; the Morgan Stanley attribution and the 30% share could not be verified
A roughly $14B scale is cited by Chinese financial media; no Morgan Stanley report or 30% figure found in public sources
4
“Oracle's CDS spiked”
Confirmed — but it is a different magnitude from CRWV and must not be told as the same thing
Reuters: ORCL five-year CDS widened 26bp overnight to a record 288bp, from 260bp a week earlier
5
“CRWV needs about $45B of capex over the next 12 months against about $10B of operating cash flow — a gap of about $35B”
Partially confirmed — the figures are a Deutsche Bank estimate, presented elsewhere as if they were company numbers
Deutsche Bank research (via TFTC) estimated about $10B of OCF vs about $45B of required capex over 12-18 months; the company's own 2026 capex guide is $35B-$39B
6
“Goldman expects hyperscaler capex growth to peak at about 116% in 2026 Q3 and slow to about 20% by end-2027”
Confirmed — with one essential qualifier: growth slows, the dollar amount still rises
Goldman strategist view relayed consistently by two outlets; Goldman's own annual model has 2027 capex rising to about $1.2T
7
“Barclays estimates only about 40% of non-top-tier data-center projects will get built; power is the binding constraint”
Confirmed as to the core figure — but it is a modelling assumption, not a forecast
Commercial Times and Sina Finance reporting on Barclays: a pipeline conversion assumption of about 40% for non-hyperscaler developers
8
“UBS: hedge fund net exposure fell to the 30th percentile of five years while gross stayed above the 90th; defensives outperformed”
Confirmed
UBS desk weekly, relayed consistently by two sources; Goldman prime brokerage data corroborates the de-grossing pattern
1. “CRWV fell about 25% in a week, and the memory sector fell about 16%”
Stock move confirmed; memory only partially — and the cause is misattributed
CRWV: Reuters (Oct 16) reported the stock down another 11%-plus on Friday and nearly 25% on the week, its worst week in over 11 months; CNBC put the weekly fall at 25.21%; TIKR's close-to-close check is $82 (Oct 9) to $61 (Oct 16), about -25.6%; Finnhub's five-day return is -25.55% on the Mexican listing, consistent in scale. Four sources agree: confirmed.
Memory: Finnhub's five-day return for Micron (MU) is -14.59%; on closes, AIStockWire has MU from $1,029.00 (Oct 9) to $878.84 (Oct 16), i.e. -14.6%, with Western Digital -16.4% and SanDisk -17.9% over the same week. “The sector fell about 16%” is roughly right as an average, but individual names span -14.6% to -17.9%: partially confirmed.
The attribution needs correcting — this is the key divergence our own digging found. The direct trigger for memory stocks this week was not CRWV credit contagion. It was China's CXMT unveiling a 4F² DRAM architecture and a plan to launch server memory products by end-2026, which raised supply and competition fears (Motley Fool and Invezz both cite this as the main reason for MU's four-day slide; Citi notes CXMT's process lags the leaders by generations and mass production before 2028 looks unlikely; KeyBanc still expects Q4 DRAM contract prices to rise 15%-20%). Contagion sentiment may have added weight, but it cannot be told as the main cause.
2. “CRWV bond yields rose above 16%”
Confirmed — with the specific bonds named
Reuters (Oct 16): the yield on CRWV's October 2031 US dollar notes briefly rose through 16% on Thursday. Reuters (Oct 15, data from S&P Global Market Intelligence / LSEG): the 2032 notes traded at about 78 cents on Tradeweb, at a yield slightly above 16%.
CNBC reporting put the yield to maturity on the 9.75% 2031 notes at 15.78%, with five-year CDS above 1,140bp at one point and about 1,038bp later — up 16% on the week and 164% over a year. ICE data (via TFTC) showed CDS at an intraday high of 1,194.5bp.
The precise statement is: the 2032 notes yielded clearly above 16%, and the 2031 notes briefly crossed 16% intraday, with common quotes near 15.8%. Note also that these are secondary-market yields — they price refinancing cost and market sentiment; they do not mean the coupon on the company's existing debt jumped overnight.
3. “Morgan Stanley tracks about $14.1B of data-center project bonds dependent on CoreWeave rent — about 30% of its tracked total”
Partially confirmed — the mechanism and the scale have support; the Morgan Stanley attribution and the 30% share could not be verified
Scale, second-hand: Chinese financial outlet BT Finance wrote in a same-topic deep-dive that “about $14B of junk bonds back data-center assets whose main tenant is CoreWeave itself”, calling the structure “junk debt on junk debt”. That passage cites Goldman spread data around it; we found no “tracked by Morgan Stanley” wording.
The mechanism is documented at the level of individual deals, from multiple sources: Applied Digital issued $1.59B of bonds in June 2026 to build data centers for CRWV (the project was still at design stage); Galaxy Digital's Helios campus is fully leased by CRWV on a 15-year term with $10.4B of guaranteed rent, and its project notes carry a 9.875% coupon — more expensive than the tenant's own secured borrowing; a Blue Owl developer's Virginia project is fully taken by CRWV on a 15-year, $2.94B contract (Bloomberg, via ChainCatcher). The chain “the landlord borrows to build, the rent depends on CRWV, so the bond ultimately prices CRWV's credit” is real.
Not verified: across Reuters, Bloomberg relays and trade media, we found no Morgan Stanley research original and no source for “$14.1B / about 30%”. Under our sourcing rules, our content may describe this only as “a roughly $14B scale cited by Chinese financial media” — never under Morgan Stanley's name, and never with the 30% share.
4. “Oracle's CDS spiked”
Confirmed — but it is a different magnitude from CRWV and must not be told as the same thing
Reuters (Oct 15): Oracle's five-year CDS widened 26bp overnight to a record 288bp, from 260bp a week earlier (S&P Global Market Intelligence data); the CNBC figure was about 282bp, up about 10% on the week.
Same-day context from the same reporting: SoftBank's five-year CDS widened 24bp to 424bp, while CRWV was already above 1,000bp.
“Spiked” is justified by the record level and by the near-doubling from about 144bp at the start of the year (market-media figure). But a weekly move of +28bp and CRWV's 1,000bp-plus are not the same magnitude and should never be narrated as one. TIKR's earnings work also puts Oracle's operating-profit-to-interest coverage at about 5x, the opposite of CRWV's shortfall — same chain, different fate; the dividing line is the balance sheet.
5. “CRWV needs about $45B of capex over the next 12 months against about $10B of operating cash flow — a gap of about $35B”
Partially confirmed — the figures are a Deutsche Bank estimate, presented elsewhere as if they were company numbers
Provenance: the figure set comes from Deutsche Bank research (cited by TFTC): “over the next 12-18 months, operating cash flow of about $10B against required capex of about $45B, a gap of about $35B.”
The company's own numbers (Q2 2026 results, consistent across sources): full-year 2026 capex guidance was raised to $35B-$39B (from $31B-$35B); actual Q2 operating cash flow was just $679M, with $6.42B of quarterly capex (property and equipment) and free cash flow of about -$5.74B; full-year revenue guidance is $12.4B-$13.2B; Q3 interest expense guidance of $860M-$940M sits against Q3 adjusted operating profit guidance of only $200M-$260M. Q2 interest expense was $640M, against adjusted operating profit of $128M and a GAAP operating loss of $49M (TIKR, from the results).
Verdict: the direction — a very large funding gap, on the order of $8B-$10B per quarter — is supported by the filings. But “$45B of capex” is Deutsche Bank's forward estimate of what delivering the backlog would require over 12-18 months, not company guidance (the company's 2026 guide is $35B-$39B); and the “$10B of operating cash flow” is the same bank's forward estimate, far above Q2's annualised actual run-rate. Any use of these figures must label them as sell-side estimates.
6. “Goldman expects hyperscaler capex growth to peak at about 116% in 2026 Q3 and slow to about 20% by end-2027”
Confirmed — with one essential qualifier: growth slows, the dollar amount still rises
Goldman strategist Ben Miller's view, relayed consistently by Longbridge and Weex: hyperscaler capex year-on-year growth peaks at 116% in 2026 Q3, with consensus then decelerating quarter by quarter to about 20% by end-2027. On the same numbers, capex (net of depreciation) contributes about +11pp to S&P 500 EPS growth in 2026, +7pp in 2027, and -1pp in 2028 as depreciation starts to bite back.
Goldman GIR's annual model (Ryan Hammond's team, Sep 24, 2026 report, via AdvisorAnalyst and TechFlow): capex of about $800B in 2026, about $1.2T in 2027 (+54%), and about $1.4T in 2028 (+12%).
Two different statements must not be merged: the quarterly growth rate falling from 116% toward about 20% is a peak-and-decelerate in growth; the annual dollar amount still rises (Goldman's 2027 estimate is $1.2T). Turning “growth is slowing” into “AI spending is peaking and rolling over” is a substitution our content will not make — both sentences travel together or neither does.
7. “Barclays estimates only about 40% of non-top-tier data-center projects will get built; power is the binding constraint”
Confirmed as to the core figure — but it is a modelling assumption, not a forecast
Taiwan's Commercial Times (Oct 19) and Sina Finance (citing NetEase Tech / trade coverage) agree on Barclays' latest report: in its model, Barclays assumes a pipeline conversion rate of only about 40% for non-hyperscaler developers. It expects about 25GW of new capacity (ex-China) to come online globally in 2027, with hyperscalers taking more than 60%; new-capacity growth slows from above 100% in 2026 to about 35% in 2027 and flattens in 2028. The constraints named are land, grid connection and supply chain, plus rising financing costs.
Independent estimates of similar scale: Bernstein puts only about 35% of planned US projects in the “credible” bucket (FT, via WhaleAgent); Columbia Business School's Van Nieuwerburgh models about 45% of the roughly 509GW planned in the US never being built, with about 300GW built (Barron's).
First-hand data on the power constraint: Lawrence Berkeley National Laboratory's Queued Up: 2026 Edition (June 2026) puts the US interconnection queue backlog at 2,061GW of generation and storage at end-2025; the median wait from application to operation for projects completed in 2025 was 61 months; of capacity applied for in 2000-2020, only 13% ultimately reached operation. Morgan Stanley estimated in early October a power gap of about 34% for US AI data centers (via MoneyDJ). A live example: Microsoft exited the Loughton UK project with Nscale because grid power was not expected to connect until the 2030s (JRJ, citing the Barclays report).
The correct phrasing is “Barclays' model gives non-top-tier developers only about a 40% pipeline conversion assumption” — not “Barclays predicts only 40% will be built”. The first is a prudent assumption; the second is a forecast conclusion. They are different kinds of statement.
8. “UBS: hedge fund net exposure fell to the 30th percentile of five years while gross stayed above the 90th; defensives outperformed”
Confirmed
The UBS trading desk weekly (Torsten Sippel), relayed consistently by Longbridge and ZeroHedge: hedge fund net exposure fell to the 30th percentile of its five-year range while gross exposure stayed above the 90th percentile; the desk characterised the week as “de-grossing, not de-risking” — a market that is fragile, not outright bearish. Consumer staples rose 5% on the week and value long/short books rose 6%, a rotation from crowded growth/momentum toward quality and value. Long-only buy/sell was 36/64 and hedge fund buy/sell/short 42/50/8 — new shorting was limited; the flow was mostly longs being closed or cut, which does not match the signature of a fundamentals-driven systemic selloff.
Cross-check: Goldman prime brokerage data (via Reuters) showed global fundamental long/short funds down 2.9% in the week to October 15, in a run of daily losses; AI stocks were net sold by long/short funds for six straight sessions, and Thursday's de-grossing was about half Wednesday's — the unwind was decelerating.
This is the key evidence for judging how much of the week's fall was positioning and how much was fundamentals. We accept it and build it into our conclusion framework below.
What we could not verify (and therefore do not use)
“Morgan Stanley tracks $14.1B of project bonds, about 30% of its total” — no original source found. Banned in our content: the Morgan Stanley attribution and the 30% figure.
“Hyperscaler short-term funding costs of about 5%-5.5%” — the exact quote could not be verified word for word; we use the spread-tiering evidence instead (see counter-evidence item 3).
ARK's exact share count in its October 15 CRWV purchase — outlets disagree (193k vs 381k shares); we use only “bought on Oct 15, reported at about $11.8M”.
The transmission chains, taken apart
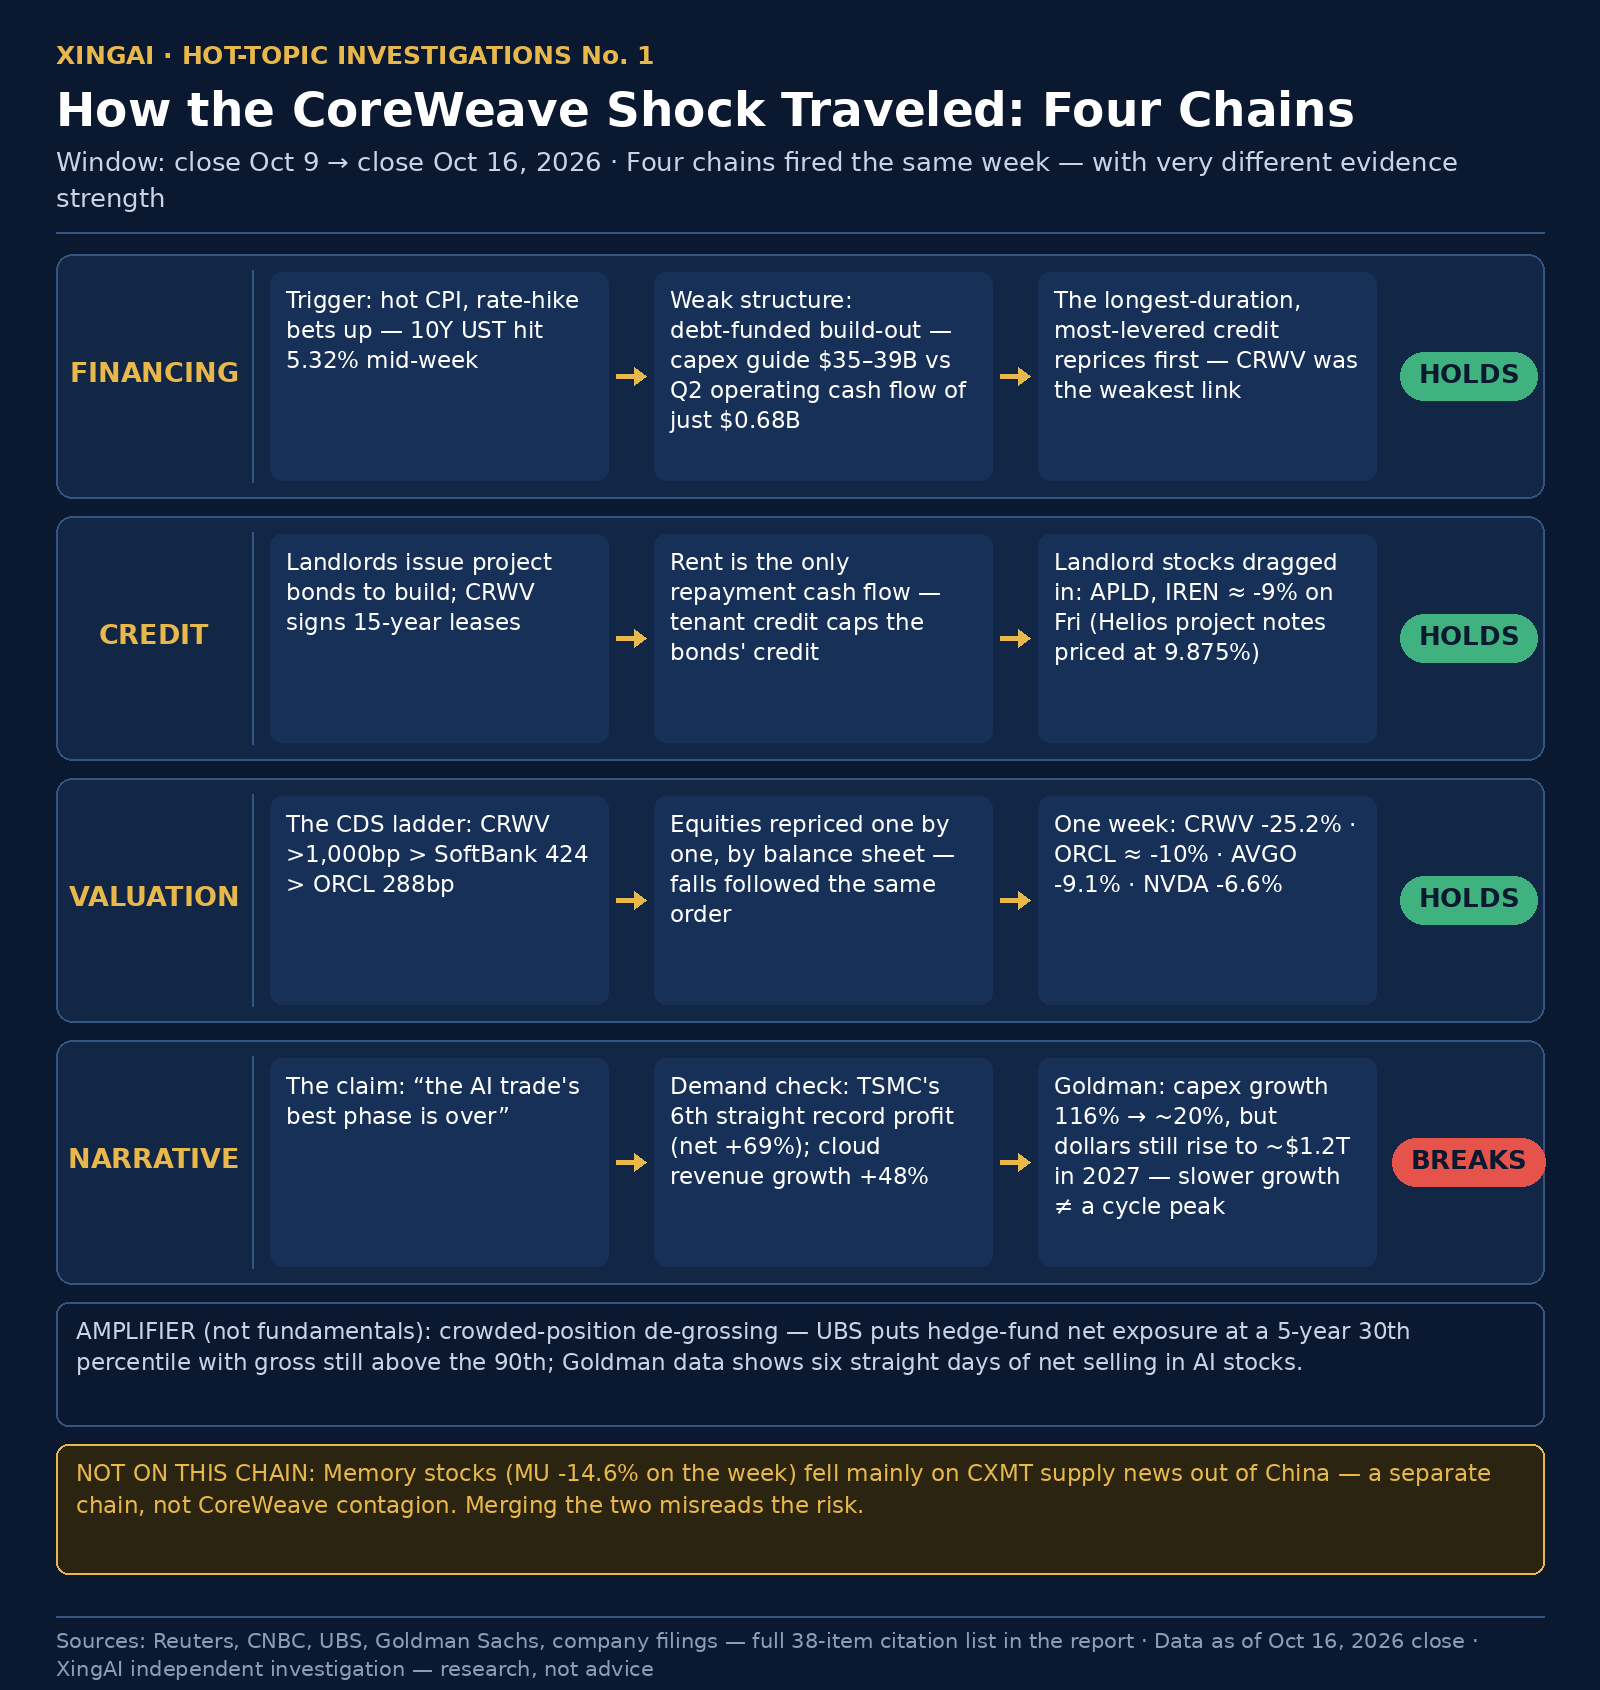
The spread was not one chain but four, stacked in the same week. Separated, their evidence strength differs — and one of the week's big falls was not on any of them.
Four chains fired the same week — three hold up under the evidence; the “AI trade is over” narrative does not. Sources in the report's citation list.
Chain 1 — Macro rates into credit pricing (the trigger; strong evidence)
Hot September inflation lifted rate-hike bets and pushed the 10-year yield to 5.32% mid-week. The longest-duration, highest-leverage, furthest-from-cash-flow assets get repriced first. CRWV's bonds and CDS were the thinnest link in the chain, and they cracked first. Reuters' own framing: inflation data boosted bets on interest-rate hikes, raising the chance of higher payouts on borrowings — the rate came before the credit event's timing.
The standard neocloud/developer structure: the developer (landlord) issues project bonds to build; a tenant like CRWV takes a 15-year lease; the rent is the only cash flow servicing the debt. So the tenant's credit is the ceiling on the project bond's credit. The control case is live: Galaxy's Helios project notes carry a 9.875% coupon, while CRWV's own secured loan backed by its Meta contract (Moody's A3) has a fixed-rate portion of about 5.9% — for the same tenant and the same campus, the market prices “with or without a tier-one customer contract as collateral” almost 4 percentage points apart. That is why landlord stocks such as APLD, CORZ and GLXY were hit (Reuters: Applied Digital and IREN each fell about 9% on Friday), and it also marks the boundary of the contagion: projects with investment-grade tenants or contract collateral priced visibly steadier.
Chain 3 — Credit tiers into equity tiers (strong evidence)
The week's CDS ranking is itself the market's tiering table: CRWV above 1,000bp (distress), then SoftBank at 424bp, ORCL at 288bp (a record), AVGO at about 136bp (an early-October record, per market media), then AMZN, GOOGL, META and NVDA at records but widening far more slowly (Reuters). Equity falls ran in roughly the same order: CRWV -25%, landlord names about -9% to -10%, ORCL about -10% (TIKR), NVDA -6.6% over five days (Finnhub), AVGO -9.1% over five days (Finnhub). The market was not selling “AI”; it was repricing the chain name by name, balance sheet by balance sheet.
Chain 4 — Crowded positioning into de-grossing amplification (strong evidence)
UBS's “net at the 30th percentile, gross above the 90th”, plus Goldman's “AI stocks net sold six straight sessions, Thursday's de-grossing about half of Wednesday's”, say that a substantial part of the fall was the mechanical unwinding of leverage and crowded trades (Wednesday's CRWV -15.5% day, with about $806M of short profits, is the footprint of that flow). Positioning-driven selling is fast, uniform and indifferent to fundamentals: it amplifies the fall, but it carries no information about demand.
Not on any chain: memory. The week's fall in MU, SK hynix, WDC and SNDK was driven mainly by the CXMT supply story (see check 1) — a “China supply” narrative, distinct from the “US financing” narrative. Merging the two chains into one misdiagnoses where Micron's risk actually sits and what would verify it.
System backdrop: the IMF's October Global Financial Stability Report tallied 14 AI deals since 2023 at about $300B of equity plus $650B of debt, against $1.4T of promised future revenue; the top five hyperscalers account for nearly 10% of 2026 global investment-grade corporate issuance, and their free cash flow is already under pressure (Reuters, citing the IMF). The financing chain's “knot” is real — but it sits at the SPV, private-credit and project-bond layer, not in the hyperscalers' own solvency.
The other side: facts a “demand collapse” story has to answer
An honest investigation has to put the strongest opposing evidence on the same page. Here it is — with its own caveats attached.
Backlog, at scale and of decent quality. CRWV's revenue backlog stood at $104.2B at June 30, 2026 (Q2 results, consistent across sources); Deutsche Bank estimates about two-thirds of it comes from investment-grade customers (Microsoft, Meta and peers); more than $25B of further commitments were added in Q3 (TechTimes, from company disclosures), and management guides to an exit annualised revenue run-rate of $18.5B-$19.5B for end-2026. CEO Intrator told staff the backlog is “enough to cover all debt obligations” (via CNBC). The other side of the same fact: backlog is a promise to pay on future delivery, not cash. About $10.6B of principal falls due by end-2027 ($4.4B in the rest of 2026 plus $6.2B in 2027, per the 10-Q as summarised by The Inference / StockTitan), against cash of about $5.5B and liquidity of about $15.55B at June 30 (company disclosure, via RuntimeWire / Bloomberg). Backlog answers “is there business?”; the maturity wall tests “does the timing line up?”
Nvidia's substantive backing. In 2025 Nvidia agreed to buy up to $6.3B of CRWV's unsold capacity through April 2032 (Reuters Factbox); in 2026 it invested a further $2B in CRWV (DataCenterDynamics and others). A supplier underwriting idle capacity with real money is not verbal support. At the same time, Nvidia is itself an equity holder exposed to this chain ($2B investments in each of CRWV and Nebius) — backing and risk-sharing are two sides of the same position.
Same borrower, two prices. CRWV's March 2026 $8.5B delayed-draw loan is supported by its Meta contract (total value above $19.2B, Bloomberg via DCD), carries a Moody's A3 rating, and has a fixed-rate portion of about 5.9%. The bond market is not refusing “everything CRWV borrows”; it is refusing unsecured, corporate-level credit. The tiering has data behind it: Goldman figures (via BT Finance) put Meta's and Google's 2025 new-issue spreads at about 170-180bp and Oracle's 30-year at about 300bp, against CRWV bond spreads of about 986-1,071bp. (The “about 5%-5.5%” hyperscaler funding-cost quote circulating this week could not be verified verbatim; the spread evidence above is what we rely on.)
Fresh evidence from the demand side. TSMC's Q3: net income NT$763.06B (+69%), revenue NT$1.494T (+51%), gross margin 66.4%, a sixth straight record quarter, advanced nodes at 79% of wafer revenue, and management saying demand far exceeds what it can supply today (Morningstar / Reuters via CTech). ASML raised its full-year outlook for a third time in the same week. Goldman GIR estimates combined hyperscaler infrastructure backlog at $1.7T, cloud revenue growth accelerating from 25% in 2024 to 48% in 2026 Q2, and revenue running about $70B above the pre-AI trend line — the monetisation evidence is imperfect, but its direction is acceleration, not a stall.
Money on the other side of the trade. JPMorgan reiterated CRWV at Overweight on October 19, arguing the debt concerns are “overdone” relative to business fundamentals and that project IRRs exceed the cost of capital (a single Chinese flash source — sentiment reference only). Yorkville's Dan Ives called the selloff a “false narrative” and pointed to demand and backlog as reasons to buy the dip (Stocktwits, citing his Bloomberg interview). ARK bought CRWV on October 15 (reported at about $11.8M; share counts differ across outlets and we do not use them). Retail investors net bought about $66M on the week, the second-highest on record (Vanda Research, via CoinPaper). The average analyst target is $140.58, about 129% above Friday's close (TIKR) — equity analysts are reading the backlog, creditors are reading the balance sheet, and neither side has yet changed its mind. That is what an unresolved divergence looks like.
Management still holds cards. Slow the capex, issue equity (at the cost of dilution), win more customer prepayments and strategic investment, and court longer money such as insurer capital (its chief development officer told the FT this week it is seeking insurer funding for GPU-cluster financing). The cards exist; each has a price. And the market is waiting for a concrete funding arrangement, not another round of verbal reassurance — the fact of this week is that reassurance did not stop the selling (Reuters and TradingNews both observed this).
Where the names in our research sit on this chain
Research positioning only — where each name in our Why I Own It research stands on this chain and what its exposure actually is. This is not a recommendation, not a buy or sell call, and not a promise of returns.
MUMicron
Sits on the memory link, and it was the deepest faller among our research names this week (five-day -14.6%, verified by two sources). But its trigger was the CXMT supply story, not the financing chain, and no first-hand evidence this week overturned its fundamental anchors (DRAM/HBM contract prices) — it was hit by a different chain, not infected by CRWV's. The two kinds of fall have entirely different things to verify next.
NVDANvidia
Sits at the top of the compute-supply link — the chain's “shovel seller”, and simultaneously a neocloud shareholder and backstop (the $6.3B capacity purchase commitment through 2032). It fell 6.6% over five days (Finnhub), far less than the names downstream; its CDS set a record too, but widened slowly. Its risk is not financing — it is the second derivative of order growth once customer capex growth peaks.
AVGOBroadcom
Sits on the custom-ASIC link, alongside NVDA among the suppliers who get scheduled first. It fell 9.1% over five days (Finnhub); its CDS hit a record of about 136bp in early October (market-media figure). Watch, too, that its customers' financing arrangements are coming under scrutiny (banks are assembling a financing package of about $60B for Broadcom and Anthropic, FT via market media) — its exposure is “its customers' financing”, not its own.
TSMTSMC
Sits furthest upstream, in manufacturing, and collects money on orders already placed. In the week the chain crashed, it delivered a sixth straight record quarter (net income +69%) — the hardest single piece of evidence that chain demand has not stalled. Its risk is lagged: if the downstream financing chain genuinely broke, order corrections would reach it last, which makes its guidance the chain's final verification point.
MSFTMicrosoft
Sits in two places at once: buyer and financing-advantage holder. It is one of CRWV's largest investment-grade customers (Deutsche Bank estimates it sits inside the roughly two-thirds investment-grade share of the backlog), and it is itself a hyperscaler that can issue debt at investment-grade cost. The steeper the financing tiers get, the larger its relative cost advantage over the neoclouds — a structural beneficiary of this chain, even while its share price is held down by the same capex-growth-peak narrative.
GOOGLAlphabet
Also on the financing-advantage side. It has issued debt at scale in 2026 to fund capex (a roughly $32B deal in February, DCD citing Bloomberg) and lends its own credit to partner projects (such as Fluidstack's) — on this chain it is a “credit exporter”. It benefits from the tiering; its constraint is the speed at which capex consumes its own free cash flow (the IMF's framing).
METAMeta
On the financing-advantage side, and simultaneously the funding customer behind CRWV's $19.2B-scale contract — the contract that directly earned one of CRWV's loans an A3 rating. Meta's credit is being “borrowed” by the neoclouds, which makes it both a beneficiary (low cost, priority supply) and a potential bearer of credit spillover on the chain. What it says about capex guidance in earnings week (October 21, after the close, per the market calendar) is the chain's weather vane.
AMZNAmazon
On the financing-advantage side. Its CDS set a record alongside peers but widened slowly (Reuters), and AWS cloud revenue growth is one of the components of Goldman's “monetisation is accelerating” case. Its position on the chain matches GOOGL's and MSFT's — a beneficiary of the tiering, where the thing to watch is the gap between capex guidance and free cash flow, not solvency risk.
Credit markets did move before equities this time, and the transmission chain (tenant to landlord project bonds to same-chain equities) is real, with deal-document-level evidence behind it.
The “buy the whole AI chain indiscriminately” phase is receding: the market has begun pricing the chain name by name, by balance sheet, funding structure and customer quality. The CDS tiering table is the evidence.
The variables that decide the next phase are whether funding gets locked in, whether projects get powered on schedule, and whether revenue turns into cash flow. We agree with that direction — but the signals have to be checkable versions of it (below).
Where we disagree, or find the evidence insufficient
The memory fall was attributed to the wrong cause. MU and its peers were triggered mainly by the CXMT supply story — a separate chain from CRWV's financing chain. Merging them misjudges both Micron's risk source and how it would be verified.
“The best phase is over” was stated more fully than the evidence allows. In Goldman's own data set, 2027 capex dollars still rise to about $1.2T; TSMC just printed a record quarter; cloud revenue growth is accelerating. The evidence supports “growth peaking plus pricing tiering” — it does not support “the cycle has peaked”. Presenting the second derivative of growth as a cycle turning point is the most common sleight in this kind of narrative.
Two load-bearing numbers cannot be used in the form they circulated: “$14.1B / 30%” has no verified source, and “$45B vs $10B” is a Deutsche Bank estimate, not company guidance. A conclusion built on unverified numbers is not made acceptable by sounding right.
Our judgment, in one paragraph
This was not a collapse of AI demand. It was a repricing of the cost of capital, plus crowded-position de-levering, landing on a financing structure whose weakness is real. The chain has not broken — but the way the chain gets priced has changed: from now on, the market looks first at who is paying, and what their money costs, and only then at who holds the orders.
Our framework: three checkable signals that separate “caught in the wash” from “expectations genuinely weakening”
1. The credit-price signal
Watch whether the company's own CDS and bond yields deteriorate in step. A stock that falls while its credit prices barely move is positioning and sentiment wash (this week's NVDA). Credit prices leading the deterioration means the market is rewriting its solvency expectations (CRWV; Oracle to a lesser degree). A share price can lie for a week; CDS lies less often.
2. The guidance and orders signal
Watch the most recent results for revenue or capex guidance cuts, key customers deferring or cancelling commitments, and contract prices loosening. Micron's verification point is DRAM/HBM contract pricing (KeyBanc expects Q4 still up 15%-20%); TSMC's verification point is its own outlook. Stock down with guidance intact is wash; guidance turning is expectations weakening.
3. The funding-in-place signal
Watch whether the money for expansion is already locked in (bonds issued, contracts signed, collateral arranged) or still to be raised. CRWV's real test is not whether the backlog is big enough — it is whether the roughly $10.6B of principal due by end-2027 and the capex after it can be funded at a knowable cost. The moment management produces a concrete funding plan rather than verbal reassurance, credit prices will answer before the share price does.
What we are watching next
October 21 earnings (META, TSLA and peers) and what they say about capex
The October 28 FOMC meeting — rates were this round's trigger, and they are also its release condition
Whether CRWV's 2032 notes and CDS fall back below distress levels
Whether CRWV management announces a concrete funding arrangement
The actual Q4 DRAM contract price settlements
How we check our numbers
Every figure on this page comes from our own investigation, published October 19, 2026. Before publication, each figure was checked against at least two independent sources. Where sources disagreed, we followed the primary source — company filings and releases, exchange data and official statistics; where no primary figure could be obtained, we dropped the number rather than estimate it. Nothing on this page is a guess, and nothing is averaged into existence. The video that prompted this investigation is a list of claims to be checked, not a source, and is not cited as evidence anywhere on this page. Figures we checked but refused to use are listed openly at the end of this page, with the reason for each refusal.
Sources
Every figure on this page comes from our investigation report of October 19, 2026 — each claim cross-checked against two sources before publication. Where sources disagreed, we followed the primary source; where no primary figure could be obtained, we dropped the figure rather than estimate it. The starting point for the claims list was a same-day market-media video; it is a list of claims to be checked, not a source, and it is not cited as evidence anywhere on this page.
Reuters (Oct 16, 2026) — CoreWeave stock, bond set for weekly plunge as rate-hike fears hit AI bet: CRWV down nearly 25% on the week, Wednesday -15.5% with ORTEX short profits, 2031 yield through 16%, APLD/IREN down about 9% reuters.com
Reuters (Oct 15, 2026) — AI credit jitters drive US tech default insurance to record highs: ORCL CDS 260 to 288bp, SoftBank 424bp, CRWV above 1,000bp, hyperscaler CDS at records but rising more slowly, IMF October GFSR tally of 14 AI deals and hyperscaler bond issuance share reuters.com
Reuters (Oct 16, 2026) — Global hedge funds hammered by AI selloff: Goldman prime brokerage data, long/short funds -2.9% on the week, AI stocks net sold for six straight sessions, de-grossing slowing srnnews.com
Reuters Factbox (Oct 2026) — CoreWeave's AI contracts and the lenders financing its build-out: Nvidia's $6.3B purchase commitment for unsold capacity (to April 2032), delayed-draw loan history srnnews.com
CNBC reporting (via TeckHustlers, Oct 15, 2026) — CRWV -25.21% on the week, 9.75% 2031 notes at 15.78% yield, CDS above 1,140bp then about 1,038bp, ORCL CDS about 282bp, CEO Intrator internal memo, Deutsche Bank backlog composition estimate teckhustlers.com
TIKR (Oct 19, 2026) — CRWV $82 to $61 close-to-close check, Q2 interest of $640M vs adjusted operating profit of $128M, total debt $51.61B including about $16.5B of leases, Oracle interest coverage of about 5x, average analyst target $140.58 tikr.com
Finnhub market data — five-day returns for MU, NVDA, AVGO and CRWV (Mexico line) MU · NVDA · AVGO
AIStockWire (Oct 17, 2026) — weekly close check: MU $1,029.00 to $878.84, Western Digital -16.4%, SanDisk -17.9%, Nasdaq -4.48% on the week aistockwire.com
Invezz (Oct 16, 2026) — CXMT news flow; Citi assessment that CXMT mass production is unlikely before 2028 invezz.com
TFTC (Oct 2026) — Deutsche Bank research as cited (operating cash flow of about $10B vs required capex of about $45B over 12-18 months, a gap of about $35B); ICE data showing CDS intraday at 1,194.5bp tftc.io
TechTimes (Aug 12, 2026) — CoreWeave Q2 2026 results: operating cash flow $679M, capex $6.42B, free cash flow about -$5.74B, net loss $626M, more than $25B of new Q3 commitments techtimes.com
TradingView / GuruFocus (Oct 15, 2026) — Oracle CDS at 288bp (from 260bp); CoreWeave 2032 notes at about 78 cents, yield above 16% tradingview.com
DataCenterDynamics — CoreWeave's $8.5B loan (MUFG and Morgan Stanley led, Moody's A3, backed by a Meta contract worth more than $19.2B per Bloomberg); Google's roughly $32B February 2026 bond deal and 2026 capex guide Loan · Bond offering
BT Finance (Oct 19, 2026) — reporting that about $14B of junk bonds back data-center assets whose main tenant is CoreWeave; Goldman spread data cited in the same piece (CRWV about 986-1,071bp, Oracle 30-year about 300bp, Meta/Google 2025 new issues about 170-180bp) businesstimescn.com
The Bright Minded — Galaxy Digital's Helios project note at 9.875% vs CoreWeave's own secured borrowing at about 5.9%; 15-year lease with $10.4B of guaranteed rent thebrightminded.com
Aadhav Rajesh industry analysis (citing Applied Digital filings) — APLD's June 2026 $1.59B project bond; how project-debt pricing tracks tenant credit aadhavrajesh.com
ChainCatcher (citing Bloomberg, Sep 24, 2026) — Blue Owl developer's Virginia project fully leased by CoreWeave on a 15-year, $2.94B contract chaincatcher.com
The Inference (Oct 2026, from the 10-Q via StockTitan) — CoreWeave maturity ladder: about $10.6B of principal due by end-2027, cash of about $5.5B, interest at 21.7% of Q2 revenue theinference.org
Longbridge (Oct 18, 2026) — Goldman Sachs strategist Ben Miller: hyperscaler capex growth peaks at 116% in 2026 Q3 and slows to about 20% by end-2027; EPS contribution from +11pp (2026) to +7pp (2027) to -1pp (2028) longbridge.com
AdvisorAnalyst (Oct 15, 2026, citing Goldman Sachs GIR, Sep 24, 2026) — capex of $800B (2026) to $1.2T (2027) to $1.4T (2028); hyperscaler infrastructure backlog of $1.7T; cloud revenue growth of 48% advisoranalyst.com
Commercial Times (Oct 19, 2026) — Barclays report: a pipeline conversion assumption of only about 40% for non-hyperscaler developers; about 25GW of 2027 additions ex-China, hyperscalers above 60% ctee.com.tw
Sina Finance (Oct 19, 2026, citing NetEase Tech) — Barclays report, second source finance.sina.cn
JRJ (Oct 19, 2026) — Barclays report, third source; Microsoft exits the Nscale Loughton UK project, where grid power would not arrive until the 2030s jrj.com.cn
Barron's — Van Nieuwerburgh model: 509GW planned in the US, about 45% never built, about 300GW built (about $10.3T through 2032) barrons.com
WhaleAgent (citing FT) — Bernstein estimates only about 35% of planned US projects are credible; at least 47 large projects delayed, withdrawn or blocked in 2026 whaleagent.io
MoneyDJ (Oct 7, 2026) — Morgan Stanley estimate of a roughly 34% power gap for US AI data centers moneydj.com
Lawrence Berkeley National Laboratory, Queued Up: 2026 Edition (Jun 2026, via The Global Statistics) — 2,061GW in the US interconnection queue at end-2025; median wait of 61 months; only 13% of capacity applied for in 2000-2020 reached operation theglobalstatistics.com
Longbridge (Oct 19, 2026) — UBS trading desk (Torsten Sippel): hedge fund net exposure at the 30th percentile of five years, gross exposure above the 90th; consumer staples +5% and value long/short +6% on the week longbridge.com
Morningstar (Oct 15, 2026) — TSMC Q3: net income NT$763.06B (+69%), revenue NT$1.494T (+51%), gross margin 66.4%, advanced nodes at 79% of wafer revenue morningstar.com
Morningstar market brief (Oct 19, 2026) — week through Thursday: NVDA -5.2%, TSM -8.4%, AVGO -7.8%; 10-year Treasury yield intraday high of 5.32% morningstar.com
Stocktwits (Oct 17, 2026) — Dan Ives (Yorkville) calls the CoreWeave selloff a “false narrative” stocktwits.com
Startup Fortune (Oct 2026) — CoreWeave seeking insurer capital to fund GPU clusters (FT, via its chief development officer); more than $35B raised in 2026 startupfortune.com
CoinPaper (Oct 2026) — ARK buying on Oct 15 (share counts differ across outlets; reference only); retail net buying of about $66M, second-highest on record (Vanda Research) coinpaper.com
Bihai123 news flash (Oct 19, 2026, single source) — JPMorgan reiterates CoreWeave Overweight, calling the debt concerns overdone bihai123.com
CryptoBriefing (Oct 2026) — Broadcom five-year CDS at a record of about 136bp in early October; Oracle at about 144bp at the start of the year cryptobriefing.com
CoreWeave Q2 2026 results / Form 10-Q (quarter ended Jun 30, 2026), as detailed by The Stock Observer (Oct 15, 2026) and Zacks — total liquidity of $15.553B at June 30, comprising cash of $5.524B and $10.014B of available credit facilities thestockobserver.com · zacks.com
Financial Times (Oct 5, 2026) — "Wall Street banks launch record $60bn chip deal for Broadcom and Anthropic": syndication of a $60B package (about $42B Broadcom-supported senior secured + about $18B junior debt) to fund Anthropic's lease of Google TPUs; Bloomberg reported the outlines on Oct 2 dealroom.co
Checked, and not used
“Morgan Stanley tracks about $14.1B of data-center project bonds dependent on CoreWeave rent, about 30% of its tracked total.” We found no Morgan Stanley original and no source for the 30% share. The $14B scale is used only as cited by Chinese financial media (reference 16); the Morgan Stanley attribution and the 30% figure are not used anywhere on this page.
“Hyperscaler short-term funding costs of about 5%–5.5%.” The quote could not be verified word for word. Not used; the spread-tiering evidence in references 16 and 3 is used instead.
ARK's exact share count in its October 15 CRWV purchase. Outlets disagree (193k vs 381k shares). The share count is not used; only “bought on October 15, reported at about $11.8M” appears on this page.
Data as of October 19, 2026. Prices and credit levels are as reported for the window October 9-16, 2026. This page is a fixed research record; it is not updated with live data.
Research and education only. This page is our own independent investigation; the views expressed are ours, and figures attributed to named institutions are summarised from the cited reports. This page is not investment advice, not a recommendation, and not a promise of returns. Read the full disclaimer before acting on anything here.